
Lines and plants
Production line simulation and bottleneck analysis
Find the real bottleneck, even when it moves with the product mix. We model lines and multi-stage plants so you can see what a new machine, a new schedule or a new product will do to capacity before you commit.
Capacity analysis
Will the plant handle the demand you are planning for?
Demand and product mix change over days and years. Equipment investments are made all the time to get more throughput or better quality. The hard part is knowing ahead of time whether the new capacity will actually show up as output.
That is difficult when an operation has any of these:
- Many products, and equipment that runs some of them faster than others
- Variable process times and equipment failures
- New processes where you are relying on vendor claims
- Many sequential or parallel steps, with time lags between them
- Competition for limited labor, fixtures, cleaning or cooling equipment
- Limited or costly in-process storage
Before you buy
Capital that would have changed nothing
Many clients have used models to learn that equipment they planned, or had already ordered, would add no output at all. The constraint was somewhere else.
In one case no model was even needed. While we worked through how to model a proposed operation with its leaders, it became clear the system could not be run as designed. They cancelled every long-lead equipment order.
A simulation has to deal with every realistic event as time moves forward. Building one forces questions like "what happens when this machine runs out of supplies or breaks?"
Moving bottlenecks
When the constraint changes with the schedule
Bottlenecks move with demand, equipment sizing, reliability and scheduling rules. Static analysis can't follow them. A model can.
A coffee plant with a new step in the middle
For quality reasons, a coffee plant inserted a new production stage between roasting and grinding in its make-store-pack operation. Roasting had always been scheduled first, and packaging had to work around it. Now, depending on the package size, in-process storage drained too fast or too slowly, and the planning system could no longer build schedules that held up.
We built a discrete rate model of the plant and used it to codify, explain and test the operation's scheduling rules. The team conceived and verified a new scheduling algorithm that held up across demand scenarios. The result was a lasting change in how the operation was understood and managed.
Operational strategies on the tour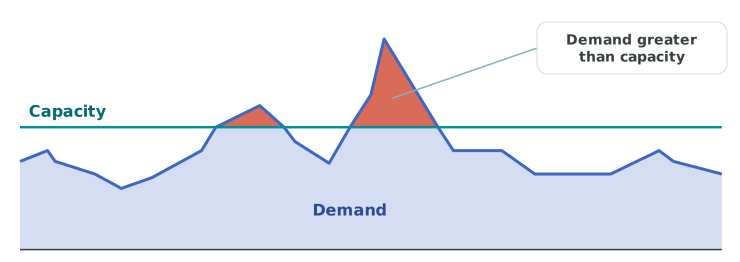
Case: olive processing
Where was the capacity going?
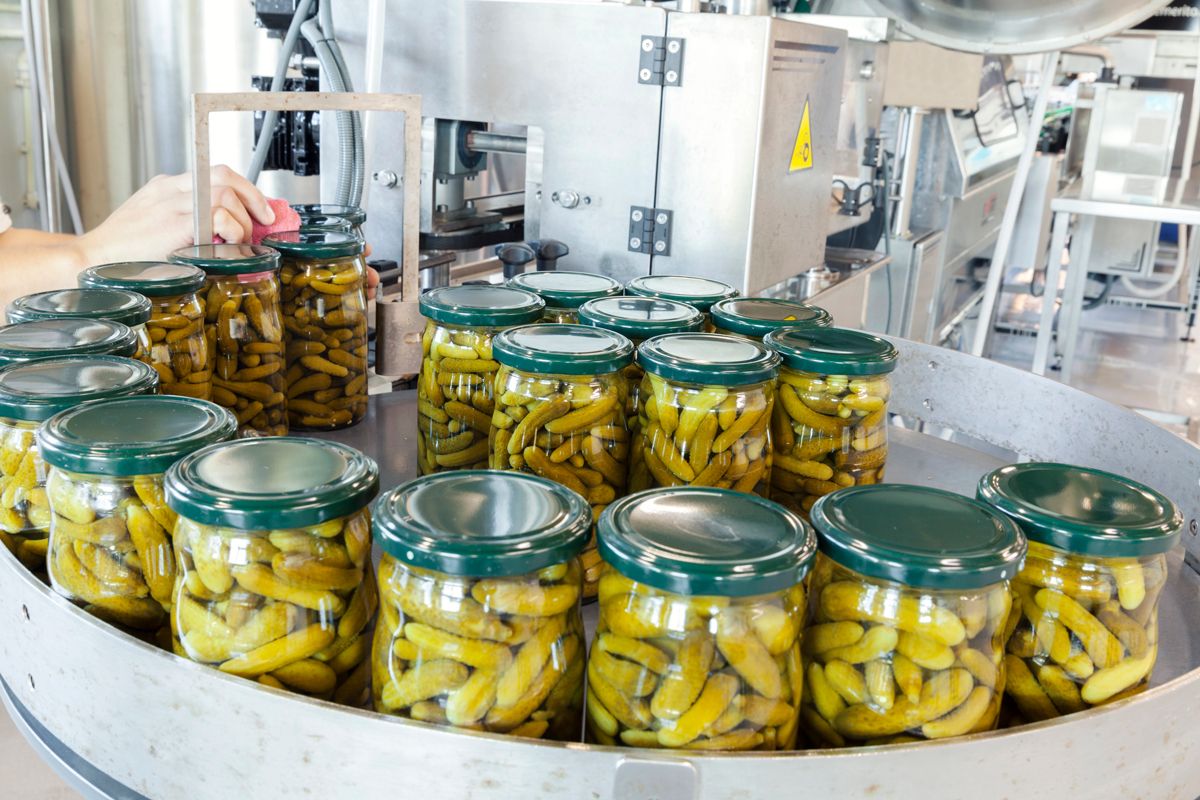
An olive processor needed to know its true capacity. The plant was large and complex, the bottlenecks were unclear, and harvest variability made planning harder. Our model confirmed the suspected bottlenecks, tested capital projects before they were approved, and showed that scheduling based on the Theory of Constraints could lift throughput by 15%. The plant moved to a daily scheduling system built on it.
"The model confirmed bottlenecks at certain operations in the plant... an effective tool to evaluate proposed capital expenditures and scheduling changes over short and long-term periods."
Robert Rugeroni, IT Director
What we model
From one line to the whole plant
- Single lines: throughput, speeds, buffers and staffing.
- Multi-stage plants: making, storage and packing, with the interactions between them.
- Capacity plans: whether current or planned capacity can handle the projected product mix.
- Operating strategies: overtime, prebuilding and new scheduling rules, and what they do to throughput and resource use.
Case studies
Manufacturing models we can show you
Olive plant capacity: 15% more throughput
Finding the real bottlenecks in an olive plant, and 15% more throughput from scheduling.
15% throughput improvement
Chemical bagging lines: capacity vs. overtime
Weighing new bagging lines against overtime, and finding low-capital room to grow.
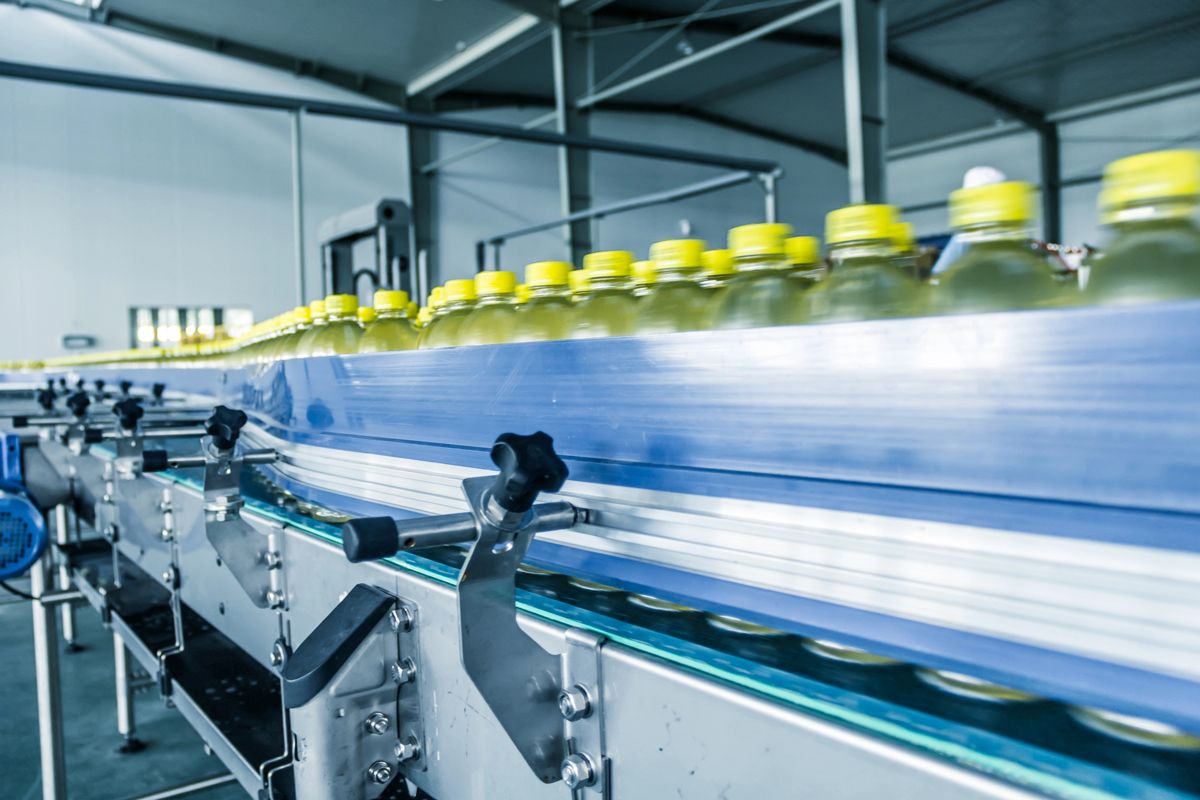
Soap plant consolidation: a $4M retrofit avoided
Folding several plants and 300+ products into one, and catching a $4M problem first.
$4M retrofit avoided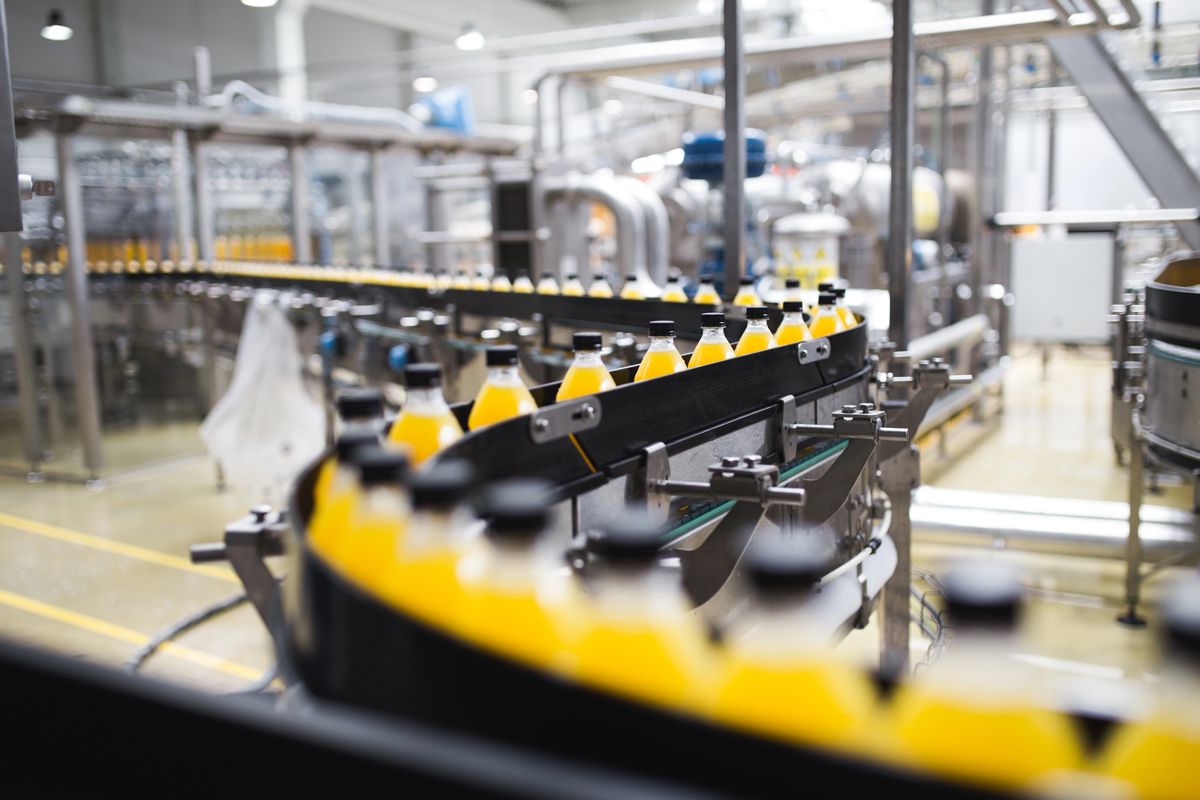
Brewpub expansion: the tanks set the limit
Adding kegging and bottling, and finding the real limit was the tanks, not the new lines.
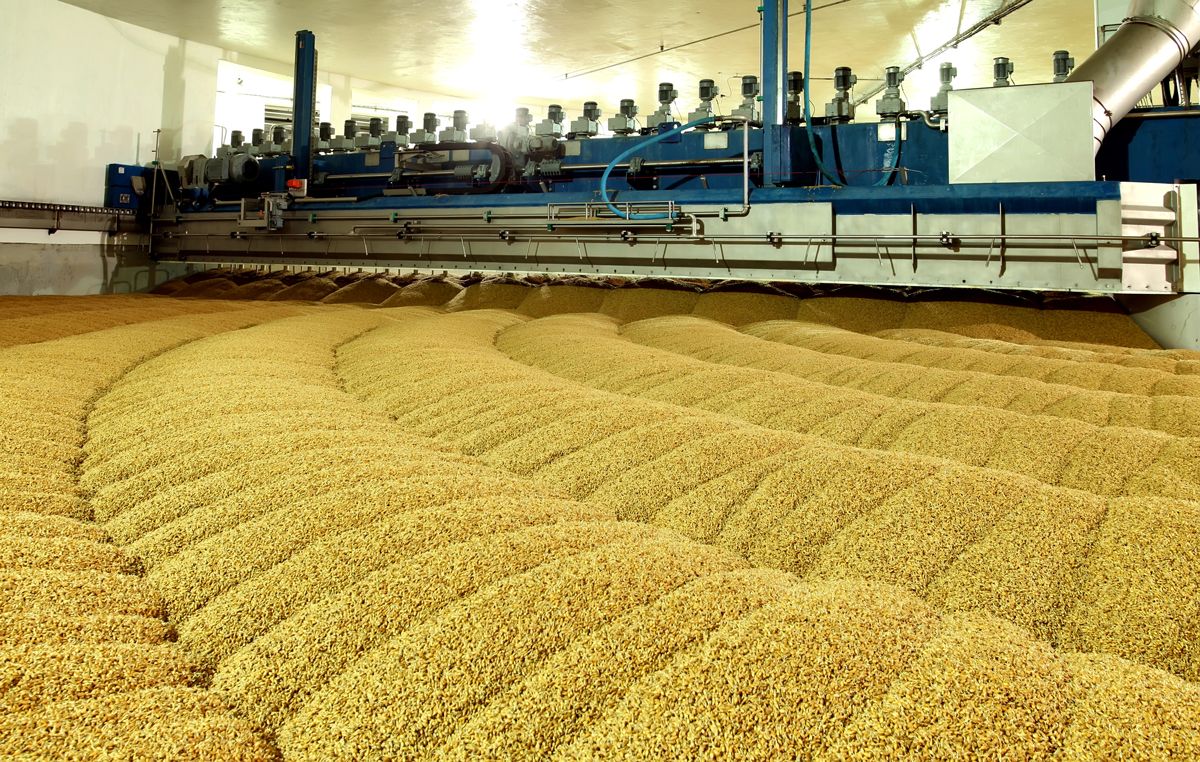
Cereal grit storage: sizing a new decoupling step
Sizing a patented grit storage step so cereal makers could see its value in their own plant.
19.8% more production at peak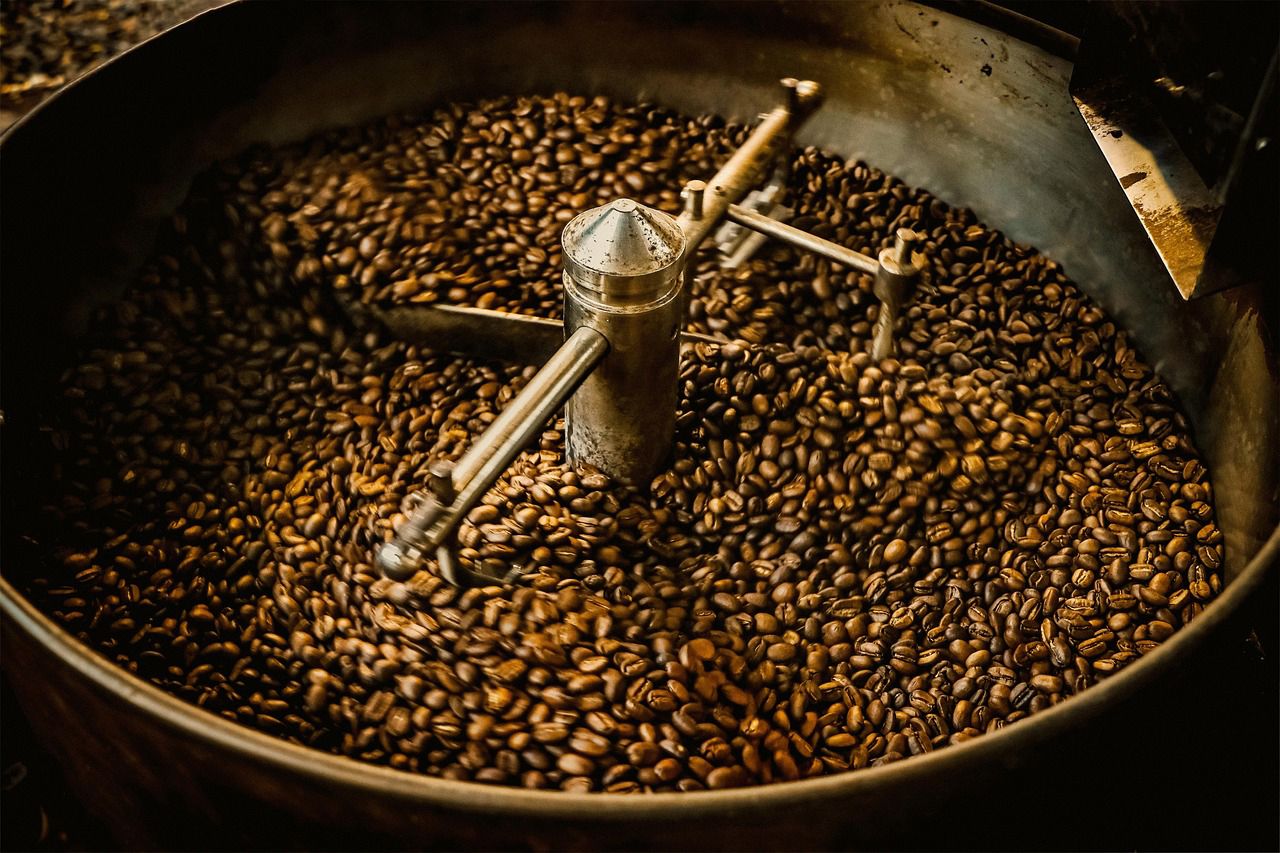
Coffee plant scheduling: a bottleneck that moves
A process change broke the schedule. The model showed why, and tested a new way to schedule.
Sizing in-process storage when reblend moves
Storage needs that moved with the schedule, and a model reused at a dozen similar factories.
12 similar factories reused the modelTell us your problem
What would happen if you changed it?
Describe the decision in front of you. We'll tell you whether a model can answer it, and what it would take.
- A straight answer on whether simulation is the right tool
- Which tool fits, even if it isn't one we use every day
- A rough scope and timeline, before any commitment