A brewpub wanted to start selling its own beer off the premises. That meant buying a kegging line, a bottling line, or both, and it expected sales to grow along with them. The capital was significant. Management wanted to know whether the brewery could keep up before any of it was spent.
The plant
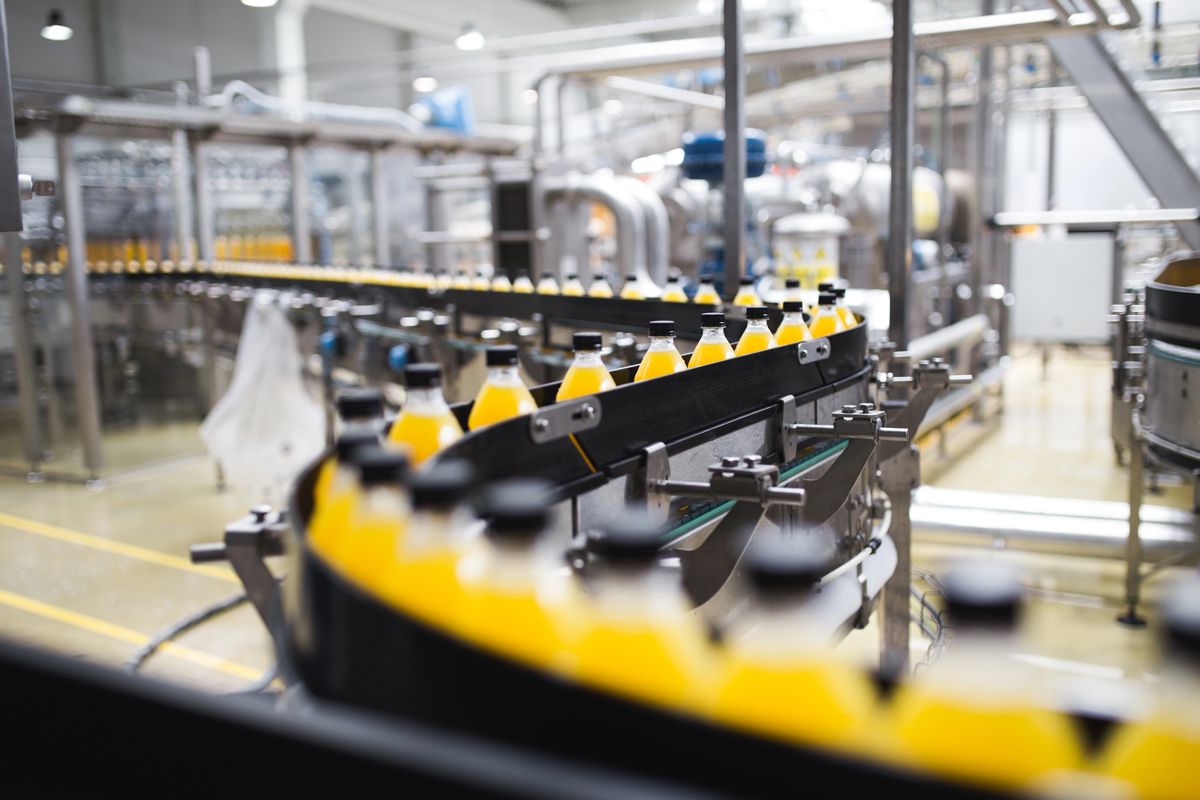
Brewing starts in the mash/lauter tun, where grain and hot water are mixed, then rinsed to draw off the wort. The wort is boiled with hops in the kettle, clarified in a whirlpool, cooled through a heat exchanger and sent to one of several fermenting tanks. After fermentation the yeast is blown down, and the beer ages in the same tank. It is then filtered into a serving tank that feeds the bar, a kegging line or a bottling line.
Different beers take very different times in those tanks. In this brewpub, ales fermented about 5 days and aged about 5 more. Lagers fermented about 10 days and could age as long as 14. Each batch sent about 18 barrels of wort to the kettle, and about 14.5 barrels reached a serving tank after evaporation. The schedule also had to keep beers apart and leave time to sanitize pipes and hoses between them.
The brewery brought five questions:
- Can the brewing equipment keep up with both on-premise and off-premise sales?
- Is it wise to spend capital on kegging or bottling?
- How should labor be scheduled across brewing, kegging and bottling?
- What is the best sequence for the different beers?
- How much extra storage do kegging and bottling need?
How we modeled it
Beer is a fluid, and chopping it into parts to fit a standard item-based model gives an answer that is either too slow or too coarse. Andy Siprelle built the model in Extend using SDI's bulk flow blocks, a library developed over several years of modeling food and consumer products plants and adapted for this brewery.
- Pumps, tanks with setpoints, and diverging and converging paths laid out the routes.
- Control blocks attached to each tank chose which tank to fill or draw from, stopped flow for schedules, maintenance and changeovers, set flow rates, and held beer for its fermenting and aging time.
- A database inside the model tied each beer to its process data, and a central control panel set up and ran the experiments.
- Adding a fermenting or serving tank meant dropping in one more block.
- Cost and revenue were tied to each process change, so every scenario reported a financial result next to its operating one.
Why trust it
The model followed the same rules the brewers did: which tank to use, how long each beer had to sit, and when lines had to stop for cleaning. Because the bulk flow blocks track tank levels and calculate exactly when a tank fills or empties, the timing of every transfer came from the process itself rather than from an average. That kept the model fast enough to compare several expansion plans side by side.
What we found
The brewhouse was not the problem. Time in the mash/lauter tun and kettle is short. Fermenting and aging take far longer, so the beer sitting in tanks set the pace.
The tank utilization trace showed that installing either a kegging line or a bottling line would overrun the fermenting and serving tanks unless capacity was added there too. The limit on the expansion sat upstream of the equipment being bought. On the floor, the new packaging lines looked like the equipment that would decide throughput. The model showed otherwise.
What changed
The capital plan had to include more fermenting and serving tanks, not only the new packaging lines. Because every scenario carried its cost and revenue, management could compare the financial and operating results of several plans before spending, and came away more confident about the return on the investment.
Source
Andrew J. Siprelle, Simulation Dynamics, Inc., Modeling a Microbrewing Facility Using Discrete Event Simulation (presentation paper). For the ReliaSim view of this study, see A Brewpub Plans Kegging and Bottling.