
Summary
Background
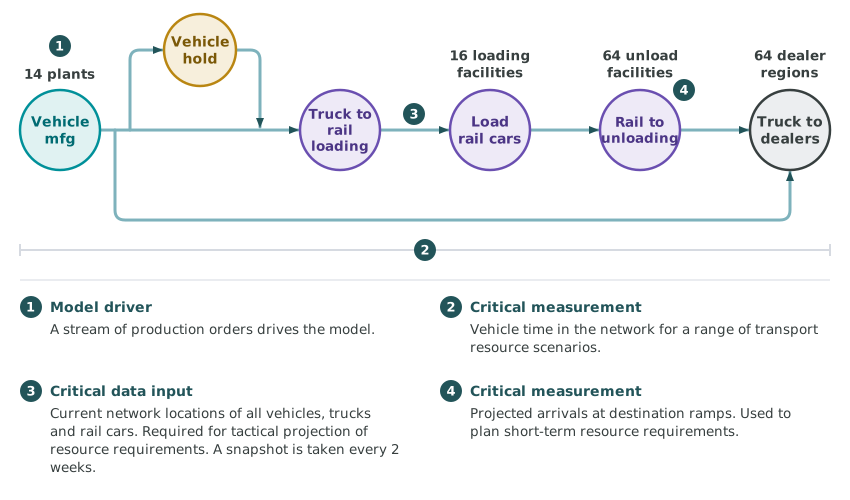
The VinLogic model was developed by Simulation Dynamics for Insight Network Logistics (INL) to support their management of delivery of vehicles manufactured by Chrysler in North America. This project represented SDI's strategic inflection point and the birth of "Model-Based Applications."
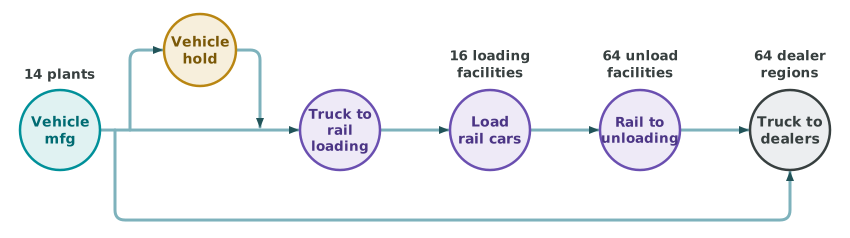
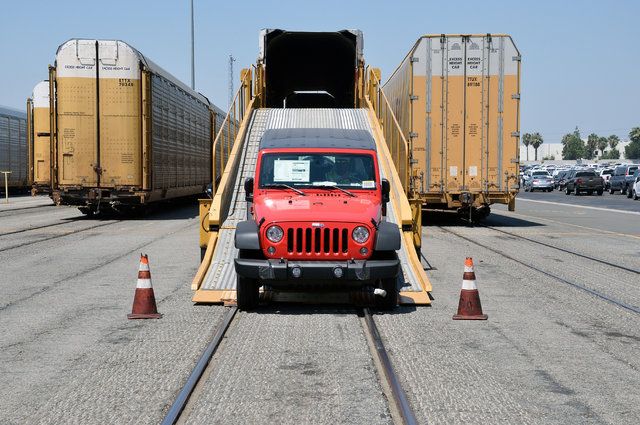
The Challenge: Insight Network Logistics, a Union Pacific subsidiary, managed new-vehicle distribution for DaimlerChrysler across North America: about 16 assembly plants, 18 rail loading facilities, 60+ rail unloading facilities, 10 ports and about 3,500 dealers, moving roughly 2.5 million vehicles a year. At any given time, over 100,000 vehicles worth billions of dollars were in transit. The goal was ambitious: reduce the number of vehicles in the network by 20% to achieve massive cost savings.
The Technical Crisis: Originally built in a major commercial DES platform using the SDI Supply Chain Builder library, the model struggled with terabytes of real-time data and took 6 hours to run. This made it unusable for business decision-making - no CFO could wait 6 hours for budget analysis, and crisis response was impossible. (The database architecture SDI originally designed for that platform has since been reimplemented as an open, cloud-accessible platform — see Cloud DB Viewer. The supply chain simulation engine has been rebuilt too.)
The Model-Based Applications Revolution: SDI made the bold decision to completely rebuild VINLogic in .NET, achieving three major breakthroughs:
- Scale: Integration with terabytes of BigData from VINVision
- Speed: Runtime reduced from 6 hours to 20 minutes (18x improvement)
- Usability: Windows Forms interface that business analysts could actually operate
Model Purpose
- Strategic assessment: budget for resources in next fiscal year based on projected vehicle production.
- Tactical: predict logistic resource requirements over the next two weeks -- simulation run weekly.
- Tactical: assess alternative responses to temporary logistic interruptions, such as from storms.
- Crisis response capability: 20-minute scenario analysis during Hurricane Katrina for contingency analysis, rerouting, and network stabilization prediction
Key model inputs
To make tactical analysis possible, the VINLogic model is connected on a real time basis to INL's VINVision system which tracks all vehicles in the network and the trucks and railcars that are carrying them.
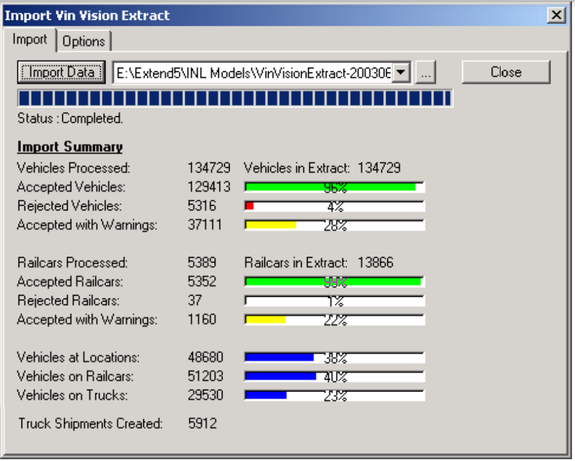
The model is initialized with this data, allowing simulation of network behavior in the near term.
Key Experiment Factors
- Resource levels (e.g. at loading ramps), rail facility interruptions, forecasted production rates
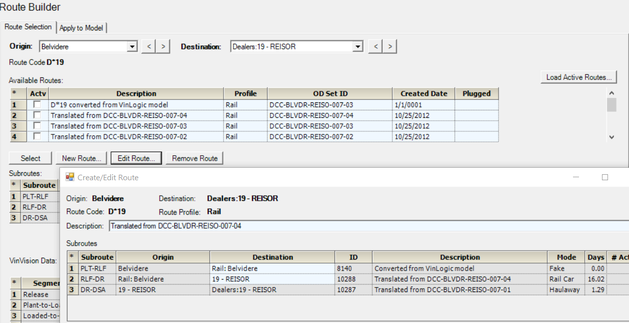
- Standard and alternate routes; user editable
System Performance Measures
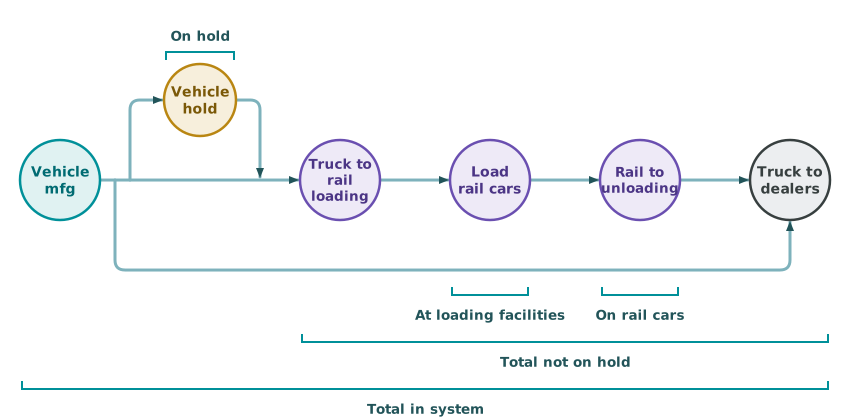
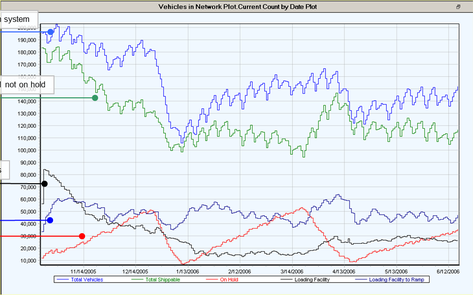
- Primary reports: Vehicle inventories in network, time in network, local delays
- Secondary reports: all dwell times, all network segment durations, all network segment inventories
Business Impact & Results
Quantified Business Value:
- $21.7M in inventory carrying costs saved and transit time reduced 19% from one set of recommendations
- Forecast accuracy of over 90%
- Used continuously for over 10 years as core business asset
- Successfully managed Hurricane Katrina network disruptions with real-time rerouting
The Business Transformation: The transformation enabled:
- Weekly analyst runs for operational planning became practical
- CFO budgeting tool - the executive could run scenarios independently
- Crisis response capability - 20-minute scenario analysis during emergencies
- Sustained business value - continuous operation as a core business asset
Key Model Issues
Plot of Network Activity
Project Results
The modeling became so reliable that business analysts ran it weekly for labor planning, and the CFO used it for annual budgeting. During Hurricane Katrina, VINLogic proved its worth by successfully rerouting vehicles and estimating recovery time.
"VinLogic is at the heart of what we do. Our analysts run it every week. I run the model to more accurately predict our annual budget! The reason we never call you is because the model just works." - CFO, Insight Network Logistics
"[We] leveraged VINLogic to recommend solutions that saved $21.7M in inventory carrying costs and reduced transit time by 19%." - Mike Keller
"[We] achieved an industry leading forecast accuracy rate of over 90%" - Brian Maloney
"We were looking for a product that would integrate well with VinVision™, our advanced vehicle management system. The ability to use current and historical data from VinVision to simulate future vehicle distribution patterns will help us more effectively manage our resources and anticipate potential bottlenecks before they occur. We chose SDI's product because we felt it could be easily integrated with our system, implemented faster than other alternatives and ultimately help us take time out of our client's current distribution process." - Roland Fortner, General Manager at INL
Strategic Legacy
The Strategic Inflection Point: VINLogic convinced SDI that "the future wasn't just in models, but in Model-Based Applications" - applications where powerful decision intelligence engines are wrapped in business-domain interfaces that users can operate independently. This insight shaped SDI's entire strategic direction, leading to the birth of our Enterprise Apps capability and comprehensive three-group architecture.
Strategic Assessment
The following provides links to articles within this document that address strategic assessment issues related to this case study:
- Tactical Analysis of System Loading
One on-going function of this model is to forecast the rate of arrival of vehicles at rail unloading facilities over a two week horizon. This forecast provides the basis for planning personnel shifts at each unloading facility. - Network Capacity
The VinLogic model is used to assess the capacity of all network segments as a function of scheduled production and alternative logistic resource scenarios.
WinterSim Paper
Initializing a Distribution Supply Chain Simulation with Live Data; Malay Dalal, Union Pacific Railroad; Henry Bell, Mike Denzien, Simulation Dynamics; Michael Keller, Insight Network Logistics. Winter Simulation Conference, 2003