
Insights
Why the EOQ answer misleads run-length decisions
Longer runs mean fewer changeovers, and that saving is easy to count. The costs that come back later, through forecast error and stock in the wrong place, are much harder to see.
The textbook answer
Every production run carries fixed costs: the changeover time, the labor, the scrap while the line settles. Spread those costs over more units and the cost per unit goes down. That is the case for long runs.
Against it sits the cost of holding what you made. As long as the line makes product faster than customers use it, a longer run leaves more inventory sitting around for longer. Carrying cost rises with run length.
Put those two curves together and you get the classic economic order quantity (EOQ) problem. Total cost is lowest where the falling fixed-cost curve meets the rising carrying-cost curve. The equations are tidy and the answer is a single number.
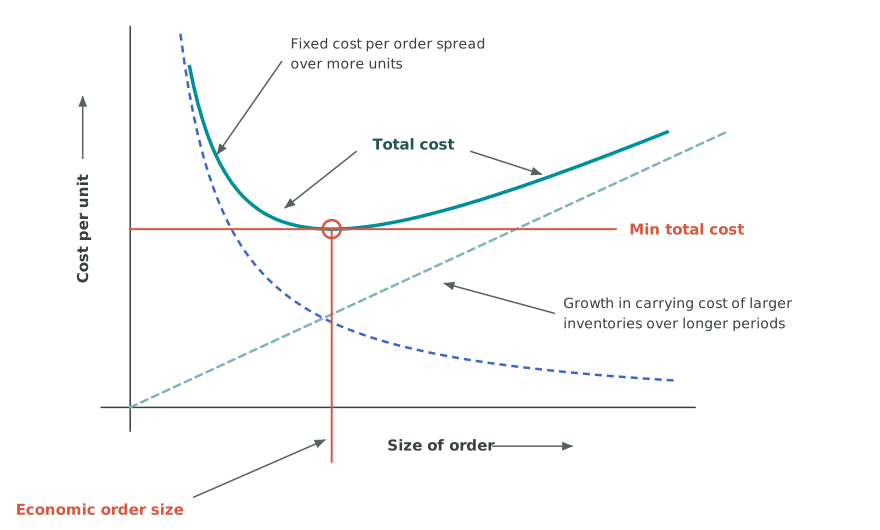
The problem is what the picture leaves out. EOQ does not consider forecast error or misallocation in the supply chain. For many plants, those are the costs that decide whether a long run was a good idea.
Three forces behind run length
Run length is hard to set because three forces pull against each other.
Production outpaces demand, and that makes cycle stock
If a product is made at 1,000 units a day and used at 50 units a day, a one-day run is needed once every 20 days. The result is 19 days of cycle stock. Cycle stock is the part of a run that is not consumed downstream while the run is going on, and it argues for shorter runs. If production and demand rates are about the same, a line can be dedicated to the product and there is no run-length question at all.
Changeovers cost time and money
Each switch from one product to the next costs time and money, which argues for longer runs. If changeover time and cost could be cut to zero, long runs would stop paying.
Forecast error leads to misallocation
This is the force EOQ misses. Many consumer products come in many variants made from one base run: package sizes, regional labels, add-ons. During each run, the base product has to be split among those finished items, and the split is based on a forecast of demand for each one over the whole production cycle. In the example above, that is a 20-day forecast.
When the forecast is off, one finished item runs out well before the others. That triggers the next run of the base product early. Earlier runs mean more cycle stock of everything else. The longer the run, the further ahead the forecast has to reach, and the bigger the error.
Where the cost shows up
Run-length costs rarely show up on the production line. They show up downstream.
- Deployment. Cycle stock has to live somewhere: in bulk at the plant, as finished goods at the plant, or shipped out to distribution centers. When plant storage is scarce, it usually gets pushed to the DCs.
- Allocation to DCs. Stock pushed downstream has to be split among DCs by forecast. Some run out while others sit on too much, and product gets redeployed from one DC to another.
- The wrong products. The products with the highest ratio of cycle stock to throughput tend to be the low-volume ones, and those tend to have the least predictable demand.
- Lost flexibility. The operations where run length matters most are often the capacity limit of the whole supply chain. Longer runs leave less room to react, so a run may start late because the previous one had to finish. That calls for more safety stock downstream.
We saw the misallocation effect directly in an inventory deployment study for a consumer goods manufacturer, where bulk runs came on cycles of 7, 14, 28 or as much as 91 days. When cycle stock was pushed downstream, some DCs ran out early, redeployment from other DCs was not always feasible, and the result was early production triggers. Read the inventory deployment case.
Testing run length on a whole network
The better way to set run length is to test it against the supply chain it feeds. In one test case, a company had four plants making 14 brands on five mixing systems. Those systems fed packaging lines producing 18 SKUs. Customers were supplied from seven company-owned DCs, with a few supplied directly from the plants. Each DC had a primary plant, plants could shift demand to one another when demand ran over capacity, and product was prebuilt when demand exceeded capacity system wide.
The model varied run length and measured the effect on changeover costs, inventory costs and customer service. The chart below comes from that study.
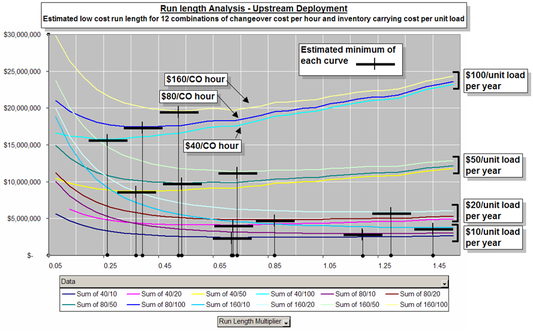
Two things stand out. First, the low-cost run length is not one number. It moves with the cost assumptions: the curves with the highest carrying cost reach their minimum at the shortest runs, and the curves with the lowest carrying cost reach it at much longer runs. Second, many of the curves are fairly flat near their minimum. A range of run lengths costs about the same, which leaves room to choose the shorter end and keep more flexibility.
The findings are in Impact of Run Length on Supply Chain Performance, Winter Simulation Conference 2004.
What to do with this
A fuller picture of what run length costs often leads to three changes:
- Recalibrated run-length rules. Planners naturally weigh the changeover savings they can count. Showing the downstream costs makes the tradeoff honest.
- A new value on changeover reduction. Cutting the time and labor of a changeover may be worth more than anyone had credited, because it makes shorter runs cheap.
- A second look at sequencing. Controlling the order of runs to shorten changeovers can help, but the practice has hidden costs of its own, and a model can show them.
A supply chain model lets you ask "what would happen if we cut every run by a third?" and see the effect on changeovers, inventory, redeployment and fill rate together, product by product. Our own Supply Chain Builder was made for this kind of study. For how packing location changes the picture, see the downstream packaging case.
Tell us your problem
What run length is right for your plant?
Tell us how your runs are set today and what they feed. We'll tell you what a model could show about the real cost.
- A straight answer on whether simulation is the right tool
- Which tool fits, even if it isn't one we use every day
- A rough scope and timeline, before any commitment