
Background
Simulation Dynamics built a simulation model for a U.S. manufacturer of consumer goods to support assessment of alternative inventory deployment options.
Model Purpose
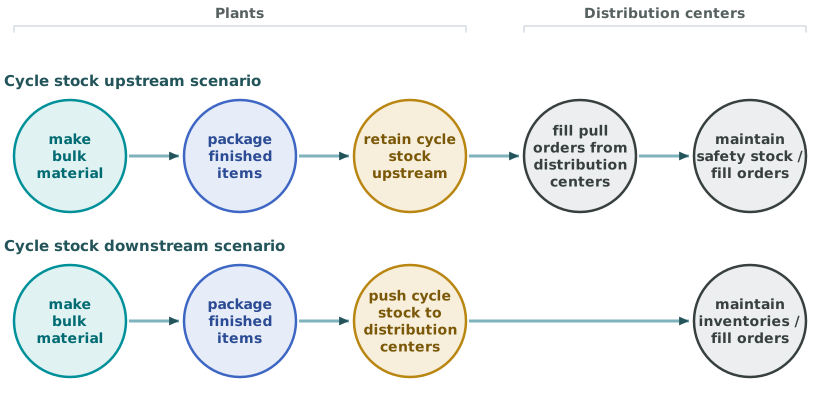
To assess the pros and cons of holding cycle stock at plants versus pushing cycle stock downstream to distribution centers.
Key model inputs
- Historical forecast and demand
- Production rates by system & product
Key Experiment Factors
- Reordering policies
- Categories of product to push downstream
System Performance Measures
- Total inventories
- Finished goods inventories
- Bulk inventories
- Customer order fill rate
- Redeployment cost
- Product disposal cost (aging)
Key Model Issues
Production cycles of the bulk material at plants may be 7, 14, 28 or as much as 91 days. The result is substantial cycle stock of finished goods. In the downstream deployment scenarios, cycle stock is pushed to downstream distribution centers. In the upstream deployment scenario, cycle stock is held upstream until downstream inventories go below their order points and trigger pull orders. In some cases pushing cycle stock downstream results in 'early production triggers', since some downstream locations run out of product early and redeployment from other downstream locations is not feasible.
Simulation provided a clear picture of the advantages and disadvantages of deployment alternatives on an item by item basis.
| Cycle Stock Upstream | Cycle Stock Downstream | |
|---|---|---|
| Pros | Reduced redeployment for high variability products. Reduction of early production triggers. | Cycle stock pushed to distribution centers protects safety stock. |
| Cons | Safety stock at distribution centers is not supplemented by cycle stock, since cycle stock is not pushed downstream. | Misallocation of cycle stock to distribution centers results in redeployment and early production triggers. |
Plot of System Behavior
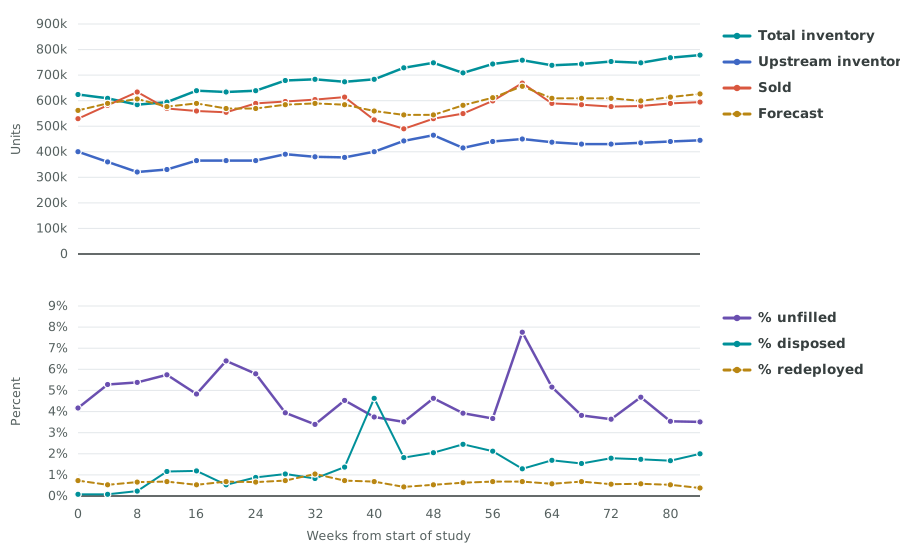
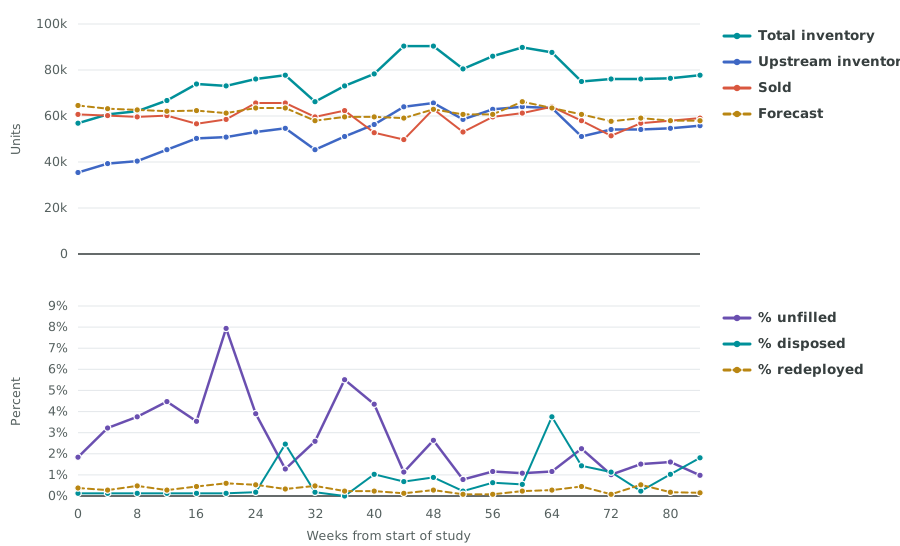
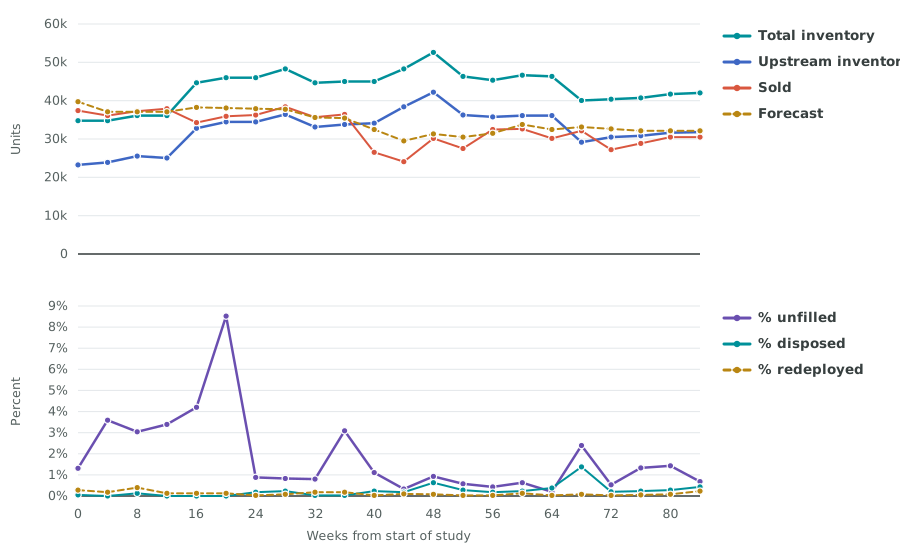
Simulation results can be plotted at any level of plant or product aggregation:
All Plants All Products
Charts redrawn from the original model output. Time is shown in weeks from the start of the study.
1 Plant All Products
1 Plant 1 Category
1 Plant 1 Brand
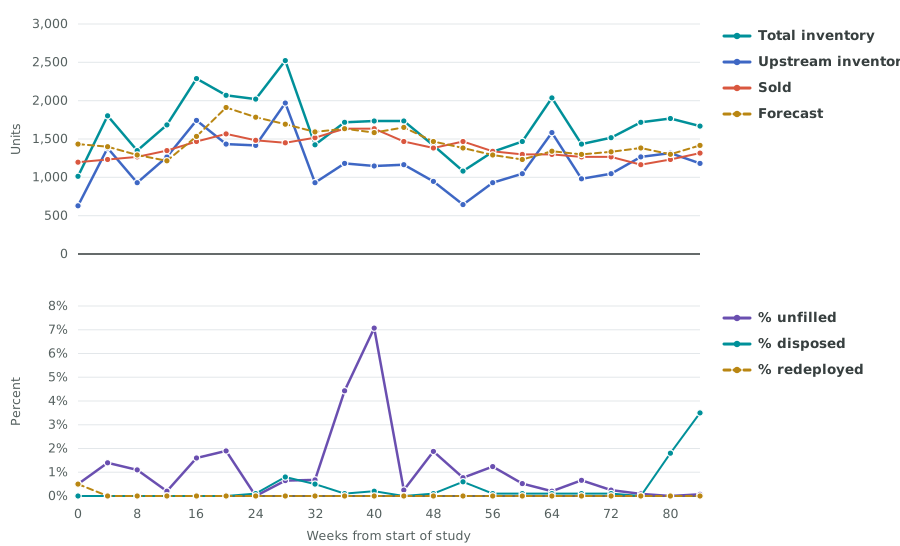
1 Plant 1 Finished Product
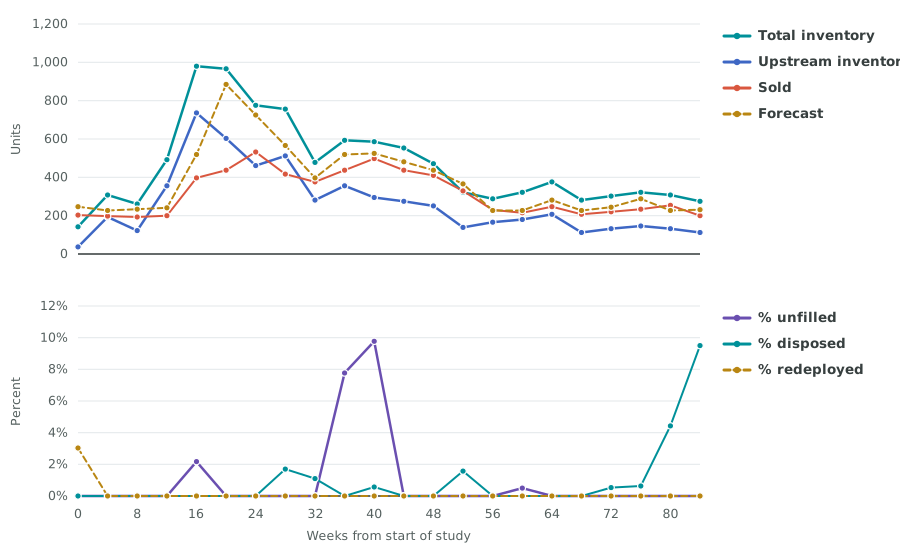
Strategic Assessment
The following list provides links to articles within this document that address strategic assessment issues related to this case study:
Inventory Deployment
A relatively minor issue in this case study was the question of where to deploy cycle stock of the bulk material shipped downstream for packaging. We concluded that it was most cost effective to keep all cycle stock upstream at the plants and fill orders from distribution centers on a pull order basis.Safety Stock Design
The baseline safety stock calculation, modified to account for fixed weekly downstream packaging schedules, accurately predicted safety stock requirements at customer facing inventories in this model.Production Capacity
In this model the first line of defense against plant capacity falling short of demand was transferring demand to another less efficient plant. If capacity system wide was under demand, prebuilds were scheduled.
Documentation
Benefits of Using a Supply Chain Simulation Tool to Study Inventory Allocation; Andrew J. Siprelle, David J. Parsons, Robin J. Clark, Simulation Dynamics. 2003 Winter Simulation Conference.