
Insights
How much buffer does a line need as variability grows?
Every stop on one machine tries to spread to its neighbors. Buffer slows the spread. The hard part is knowing how much buffer is worth paying for, and whether fixing a stop would pay more.
The coupling question
When machines run in sequence, someone has to decide how tightly to tie them together. With no accumulation between two machines, they are fully coupled. When one stops, the other stops at once. With a little buffer, the other one stops a little later, or not at all if the first one restarts in time.
That sounds simple until you look at a real operation. Machines run in series and in parallel. Each has its own design rate, its own stop history and its own changeovers. Scheduling rules decide what runs when. The question "how big should this buffer be?" depends on all of it at once: design rates, variability in every form, and the size of the bin or conveyor between the machines.
Why more buffer can mean more output
It often surprises people that adding buffer can raise throughput without touching a single machine. The reason is that most lost output on a line is not lost at the machine that stopped. It is lost at the machines next to it, which starve or block while they wait.
A buffer absorbs short stops. The upstream machine keeps filling it while the downstream one is down, and the downstream machine keeps drawing from it while the upstream one is down. Short stops stay local instead of taking the whole line with them.
But buffer is not free. Bigger in-process bins and longer conveyors cost money, take floor space and are harder to manage. At some point each added unit of buffer buys less than the one before. Where that point sits is the practical question, and it is different for every line.
Variability comes in more than one form
When engineers say "variability," they usually mean breakdowns. Breakdowns matter, but a line sees variability from other sources too:
- Reliability. Jams, faults, material outages and quality stops, each with its own frequency and duration.
- Planned events. Changeovers, cleaning, meetings, maintenance and start-up.
- Scheduling rules. Which product runs next, and for how long.
Scheduling variability is not random, but it is still dynamic. Depending on which products are running and how the equipment is set up, the bottleneck can move from one machine to another. Run too long on one product and you can end up in "bin lock": product made too fast for the storage, so you can no longer pack the product you actually need. A buffer sized for average conditions can be too small for one product and too large for another.
A buffer tradeoff experiment
Here is how we answer the question on a real model. The line below makes and mixes powder, then fills, labels, checkweighs, case packs, palletizes and stretchwraps it. Every machine carries its own stop history. The model shows each interrupt type, the machine's internal availability and how many times it went down.
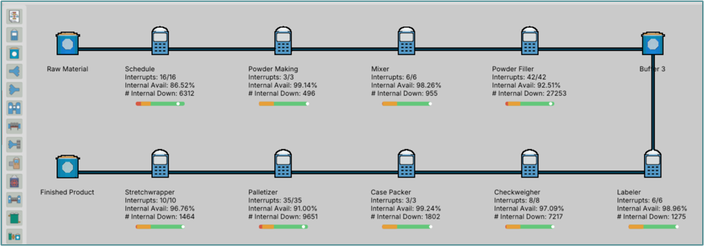
"Buffer 3" sits between the powder filler and the labeler. In the experiment, we varied its maximum capacity across a range of sizes. At zero it is only a pass-through, so the filler and labeler are closely coupled. For each size, we ran a set of scenarios:
- A baseline with every as-is failure switched on.
- One scenario per failure type, with only that failure switched off, to show what fixing it would be worth.
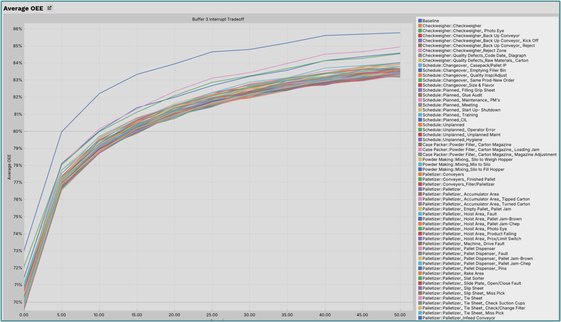
Reading the result: fix the stop or buy the buffer?
Every curve has the same shape. OEE climbs steeply with the first bit of buffer, then flattens. The knee of the curve is the practical answer to "how much?" Past it, you are paying for steel and floor space that barely moves output.
The gaps between the curves answer a second question that matters just as much. A curve that sits well above the baseline marks a failure worth fixing. If fixing that failure lifts OEE more than doubling the buffer would, the money belongs in maintenance or engineering, not in a longer conveyor. If the curves bunch together, no single fix will do much, and buffer is the better lever.
This is where a model earns its keep. The same chart puts capital spending and reliability work on one scale, so the team can compare them directly instead of arguing from rules of thumb.
When the right size moves with the schedule
On some plants, there is no single right buffer size. A consumer products manufacturer needed to know how much in-process storage it required between making and packing. Some material was reblended back into the process, so the flow into storage depended on what had been scheduled. Change the schedule and the reblend changed, and so did the storage the plant needed.
The two ways to get it wrong did not cost the same. Too much storage ties up capital. Too little backs up into the making process and stops the most expensive end of the plant. Our discrete rate model, with a custom schedule generator, showed that some problems that looked like they needed more tanks could be solved with scheduling parameters instead. The model was later adapted at a dozen similar factories. Read the reblend storage case.
Buffer is really time
A buffer's real job is to let two parts of a plant run on different clocks. In one cereal project, a patented step let cooked corn grit be stabilized, stored and fed back in later. The model, driven by a year of the plant's own weigh belt data, found that one off-ramp and one on-ramp gave 19.8% more production at peak. The capacity did not come from new equipment. It came from letting the cooking end and the downstream end stop running in lockstep. Read the cereal grit case.
Why this needs a model
A spreadsheet can compute average rates and average availability. It cannot tell you how often two stops overlap, how long a buffer takes to fill or drain, or which machine starves when a changeover lands at the wrong moment. Those are timing questions, and the answer depends on the sequence of events.
A discrete rate model is well suited to this work. It tracks the line as flows and only calculates when a rate changes, so an experiment with dozens of failure scenarios, many buffer sizes and many replications runs in practical time. You can ask "what would happen if we doubled this conveyor?" and "what would happen if we fixed the labeler's jams?" and see both answers on the same chart before anyone orders equipment.
The same approach applies whether the buffer is a conveyor on a packaging line, a bin between making and packing, or a silo in a multi-stage plant.
Tell us your problem
How much buffer does your line need?
Tell us about the line, its stops and the buffer you're weighing. We'll tell you what a tradeoff experiment could show.
- A straight answer on whether simulation is the right tool
- Which tool fits, even if it isn't one we use every day
- A rough scope and timeline, before any commitment