
Summary
Background
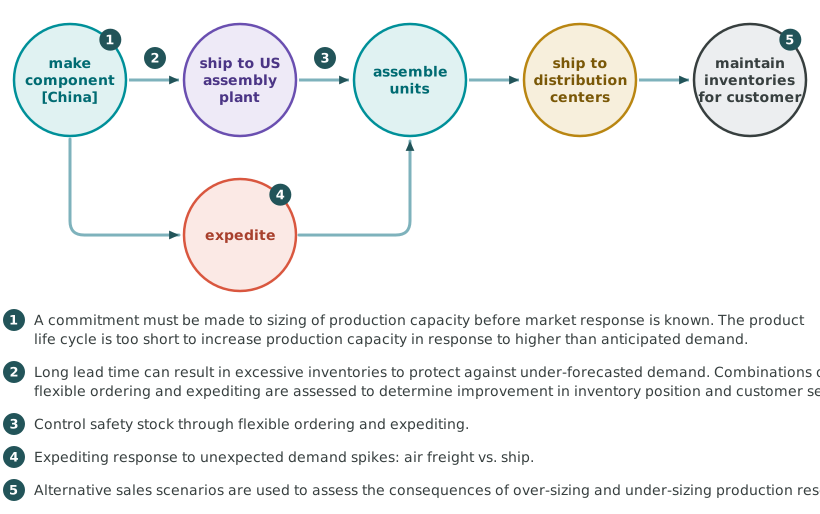
In collaboration with a manufacturer of electronics gear, SDI developed a simulation model to assess problems inherent in production of key components overseas.
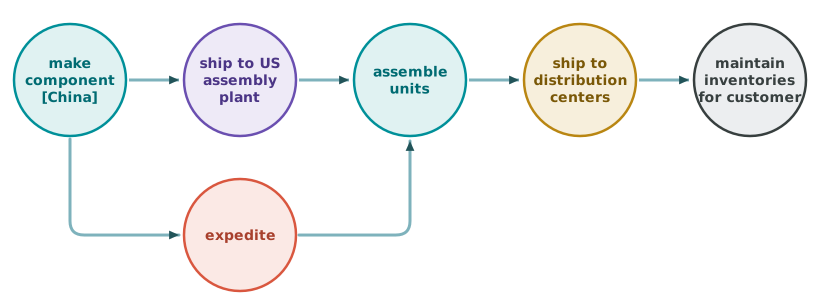
There is an allowance of 30 days for loading, transit and unloading, including customs.
Model Purpose
The model addressed three interrelated challenges:
- The difficulty of forecasting total and peak demand during the two year life cycle of a consumer electronics product line.
- The necessity of making capital commitments to production capacity in advance of production.
- The impact of long lead times (three to six months) on inventory management and customer order fill rate.
Key model inputs
- Life cycle demand and forecast combinations
Key Experiment Factors
Experiments were conducted to assess three strategic questions:
- What are the consequences of over forecasting and under forecasting at several levels of capital commitment to production?
- What are the potential advantages of using flexible ordering? What degree of flexibility strikes a balance between customer flexibility and supplier costs?
- What are the potential advantages of using expedited shipments.
System Performance Measures
- Capital equipment cost
- Cost of prebuilding inventory when and if peak demand is over capacity
- Total shipping cost
- Inventory requirements in China and at the US assembly plant
- Customer service
Key Model Issues
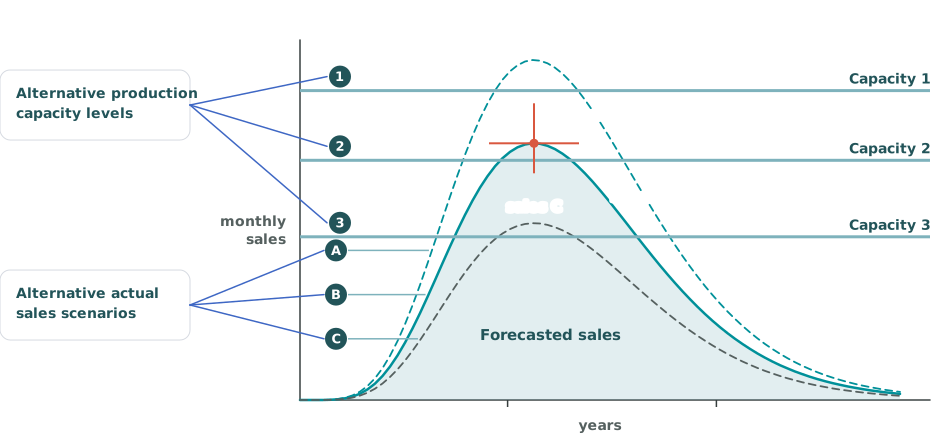
Actual Sales vs. Capacity
Simulation provided an assessment of the consequences of combinations of actual sales and capital investment.
| Actual Sales A (high) | Actual Sales B (medium) | Actual Sales C (low) | |
|---|---|---|---|
| Capacity 1 (high) | Moderate prebuild during peak period | No prebuild. Capital investment somewhat excessive | No prebuild. Capital investment very excessive |
| Capacity 2 (medium) | Massive prebuild during peak period | Moderate prebuild during peak period | No prebuild. Capital investment somewhat high. |
| Capacity 3 (low) | Capacity unable to keep pace with sales | Massive prebuild during peak period | Moderate prebuild during peak period |
Strategic Assessment
The following provides links to articles within this document that address strategic assessment issues related to this case study:
Life Cycle Resource Management
The primary purpose of this model is to study the consequences of a mismatch between capacity and life cycle peak demand.Production Capacity
The only strategy available to cope with periods of capacity under demand was pre-building.Flexible Ordering
Flexible ordering was used as a primary tool to reduce large safety stocks at the US assemble plant. The need for large safety stocks results from long lead times results from short term demand unpredictability.
Documentation
Safety Stock Savings from Flexible Ordering: A Simulation Study; David J. Parsons, Simulation Dynamics.